share

WHY NEW PRODUCT PLANNING IN LUXURY EYEWEAR SHOULD HAND A PLANNER A RANGE, NOT A NUMBER?


11:40, The Buy Committee

Ananya plans demand for the sunglass range at a luxury eyewear house. Style MV-4412 is on the table today: a new acetate front, four colourways, two sizes. Eight SKUs from one drawing.

The tooling slot at the Italian plant closes on Friday. The acetate sheet for the Havana colourway has a five-hundred-piece minimum. So whatever number she gives today is not really a forecast. It is a purchase.

The system has produced one. It picked a reference style which is same category, same price band, launched two seasons ago, copied that style's sales curve, and multiplied it by a marketing index for the ambassador campaign in week three. Two thousand four hundred units. Six hundred per colourway.

Ananya doubts all of it. The reference was a metal aviator; this is acetate. The marketing multiplier came from a cell nobody can trace. And she is fairly sure the Havana is the one people will pick up, because the Havana usually is. She has no way to say that in a form the system will accept.

She also has no alternative. The plant needs a number on Friday. She signs off at 2,400, six hundred four ways, and the style goes into tooling. 


Week 6

The Havana sold out on day eleven. The plant quotes fourteen weeks to make more, against a thirteen-week season. So the answer is no. About five hundred and eighty people will ask for that frame this season and be offered something else.

The Matte Black is at eight per cent sell-through. Four hundred and ten units will sit in the warehouse while someone decides whether they go to an outlet, an employee sale, or quietly out of the region. This is luxury. The one thing that will not happen is a discount in the main channel.

And the post-mortem will say the forecast was fine. Two thousand four hundred units committed against two thousand two hundred and sixty units of real demand. Six per cent out. Nobody raises a flag for six per cent.

That is the problem in one sentence. The forecast was accurate at the level where accuracy is worth nothing, and badly wrong at the level where the money is spent.


What is Actually Going Wrong

The system looks for a twin, and there isn't one. Like-item forecasting assumes a new product is an old product with a new code. In eyewear that assumption breaks. What drives demand is how a frame looks on a face, and that is the one thing with no history behind it. A study of about a million fashion styles put it plainly: past sales are not, on their own, useful for predicting demand for new designs. It gets worse. The reference style is usually chosen for administrative reasons such as same category, similar price, launched around the same time of year. Those describe the paperwork on a frame, not the reason anyone buys it.

The number is made at a level nobody manufactures at. One of the largest eyewear groups sets out the arithmetic in its own regulatory filings: each style is typically made in two sizes and five colours. One drawing becomes ten SKUs before you count lens options. The forecast is made once, for the style, then split across those SKUs using last year's colour and size shares. But colour is a fashion choice and size is a matter of face shape. Neither was inherited from the reference style. So the style number can be right while every SKU under it is wrong and the SKU is what gets tooled, cut, polished and shipped.

Judgement goes into the number and leaves no trace. Marketing's view of a campaign is not worthless. It is often the best information in the room. But it arrives as a multiplier in a spreadsheet cell, with no name on it and no score kept. The research here is uncomfortable. In one study of 169 products over three years, 82% of forecasts were adjusted by hand and during promotions, exactly when people feel most compelled to step in, those adjustments raised the average error from 59% to 97%. A larger study covering more than 60,000 forecasts found that small adjustments hurt accuracy more often than large ones, and that upward adjustments were both the least likely to help and the most likely to go the wrong way. A third study found the reason: forecasters give their own last override about three times the weight they give their own last error. None of this says remove the human. It says make the human's input visible enough to score.

The forecast says nothing about how reliable it is. A single number invites a single commitment. But the founding study of this problem, done with a skiwear maker, found that about half of pre-season forecasts landed within 10% of what actually sold. The other half missed badly: some styles sold three times the forecast, others sold less than a sixth of it. One number cannot tell you which half you are in. And which half you are in is what should decide how much you commit.

The cost lands in three places. Stock left over on the colours that did not sell, which in luxury is not a markdown but a channel problem, because research on grey markets shows that leftover stock of short-life products, more than price differences, is what pushes goods into channels the brand does not control. Lost full-price sales on the colour that did sell, unrecoverable because making more takes longer than the season lasts. And cash and tooling committed to a mix nobody in the room could defend.


The Fix: Change The Question The System is Asked

The instinct is to look for a better forecasting algorithm. That is the wrong place to look.

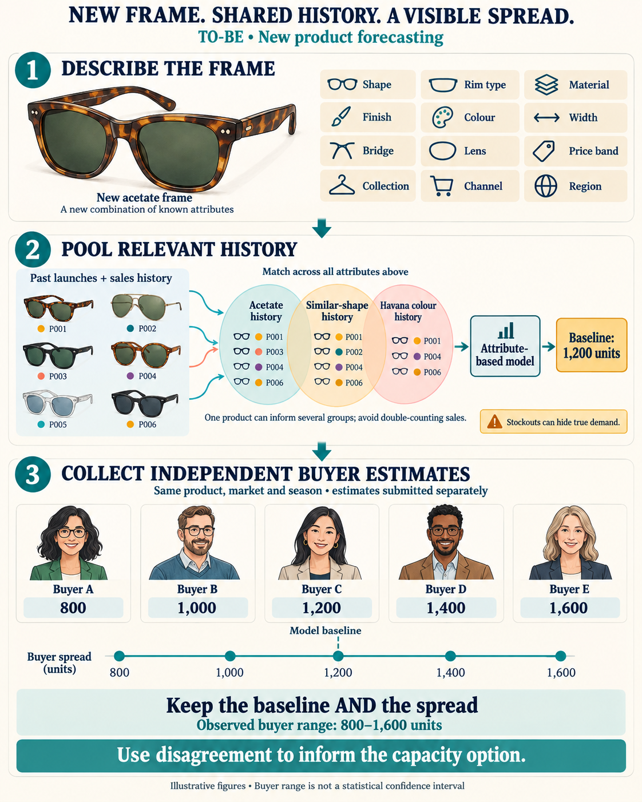
Today the system is asked: what will this style sell? There is no answer to that in the time available. It should be asked three questions instead. What do we already know about a frame like this? What shape does demand of this kind usually take? And how cheaply can we buy the part we cannot know?

A number, a shape and a spread. Three things have to be true before the answer is worth acting on. 

Describe the product before you try to sell it. Break the frame into what it is made of: shape, rim type, material and finish, width, bridge, lens, price band, collection, channel, region. Every one of those has sold thousands of times before. A new frame is a new combination, not a new phenomenon. Pooling history across matching attributes, instead of copying one chosen twin, works: one published study reports error reductions of 20–60% across product groups using this approach. The capability is not the hard part. Most planning platforms now sell attribute-based forecasting, and there is a granted US patent whose whole argument is that vague, free-text attribute descriptions produce unreliable forecasts and must be replaced with measurable ones.

Read that patent as a warning rather than a feature list. The model takes weeks to build. The attribute definitions take years to govern. If “cobalt” becomes “electric blue” next season, the pooling quietly stops working and nobody gets an error message.

One more warning, because it is the mistake most likely to embarrass the project. The history you pool is incomplete. The winners sold out, so their recorded sales understate what they would have sold. Train on raw sales and the model will under-forecast exactly the frames you most need it to spot. That is precisely what happens to the Havana in Figure B.

Take the shape from a library, not from a pen. Level and shape are two different problems, so solve them separately. The cleanest published approach uses one model to set the level and a second to pick the launch curve. Group past launches into a handful of standard shapes, then assign the new frame to one of them based on its attributes. Every planning system already has the vocabulary for this called phase-in profiles, lifecycle profiles, launch profiles. What is missing is accountability: today the curve is chosen once, by one person, with no name on it and no accuracy measured against it afterwards. And the shape people assume is often simply wrong. In a study of 170 product life cycles, more than a fifth had no steady period at all. The S-curve everybody draws on the whiteboard is the wrong shape for a fifth of launches.

Treat the spread as an output, not a footnote. This is the part that turns the industry's favourite excuse into a tool. Everyone says eyewear cannot be forecast because it is about perception and five experienced people in a room will give five different numbers. The skiwear study found that this disagreement is the most useful signal available. When buyers forecast independently, instead of being pushed towards one agreed number, the spread between their individual answers predicted the accuracy of the final forecast almost perfectly. Where they agreed, the number held. Where they disagreed, it did not. So stop forcing agreement. Collect the spread, and use it to size the option rather than the argument.

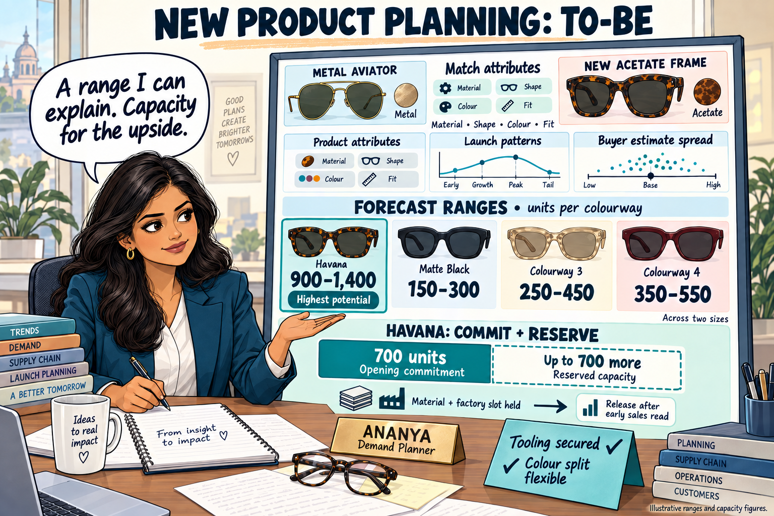
Then buy the option. Commit the floor and reserve capacity for the rest. The encouraging finding from the same research is that you do not need to be a fast-fashion retailer to benefit: holding reactive capacity worth about 30% of the season captured close to half of the total possible saving.

Eyewear makes this harder than clothing. You cannot simply reorder faster because the tooling is a four- to eight-week commitment and suppliers publish minimums of three to five hundred pieces per style and colour. So the lever is not speed. It is deciding later. Commit the tooling and the front. Hold the colour split. Reserve a sheet of material and a slot at the plant instead of finished units. That is a negotiation with a supplier, not a setting in a system, and it is the part no platform will do for you.

And listen outside your own sales data. A study across three large clothing and footwear businesses found that adding social and search signals cut out-of-sample forecast error by 24% to 57%, and that colour and fit could be read months before the season started. In a category where a head of state wearing a pair of aviators at a January summit moved the maker's share price by around 65% in two days and where that maker, having sold a thousand pairs online, could not deliver them until May.
 

What That Looks Like

Figure A was the plan as it is published today: one borrowed curve, used four times, committed in full. Figure B is the same style planned the new way using a level from attributes, a shape from the library, a range instead of a single point, and a buy split into a committed floor and a reserved option released after an early read.
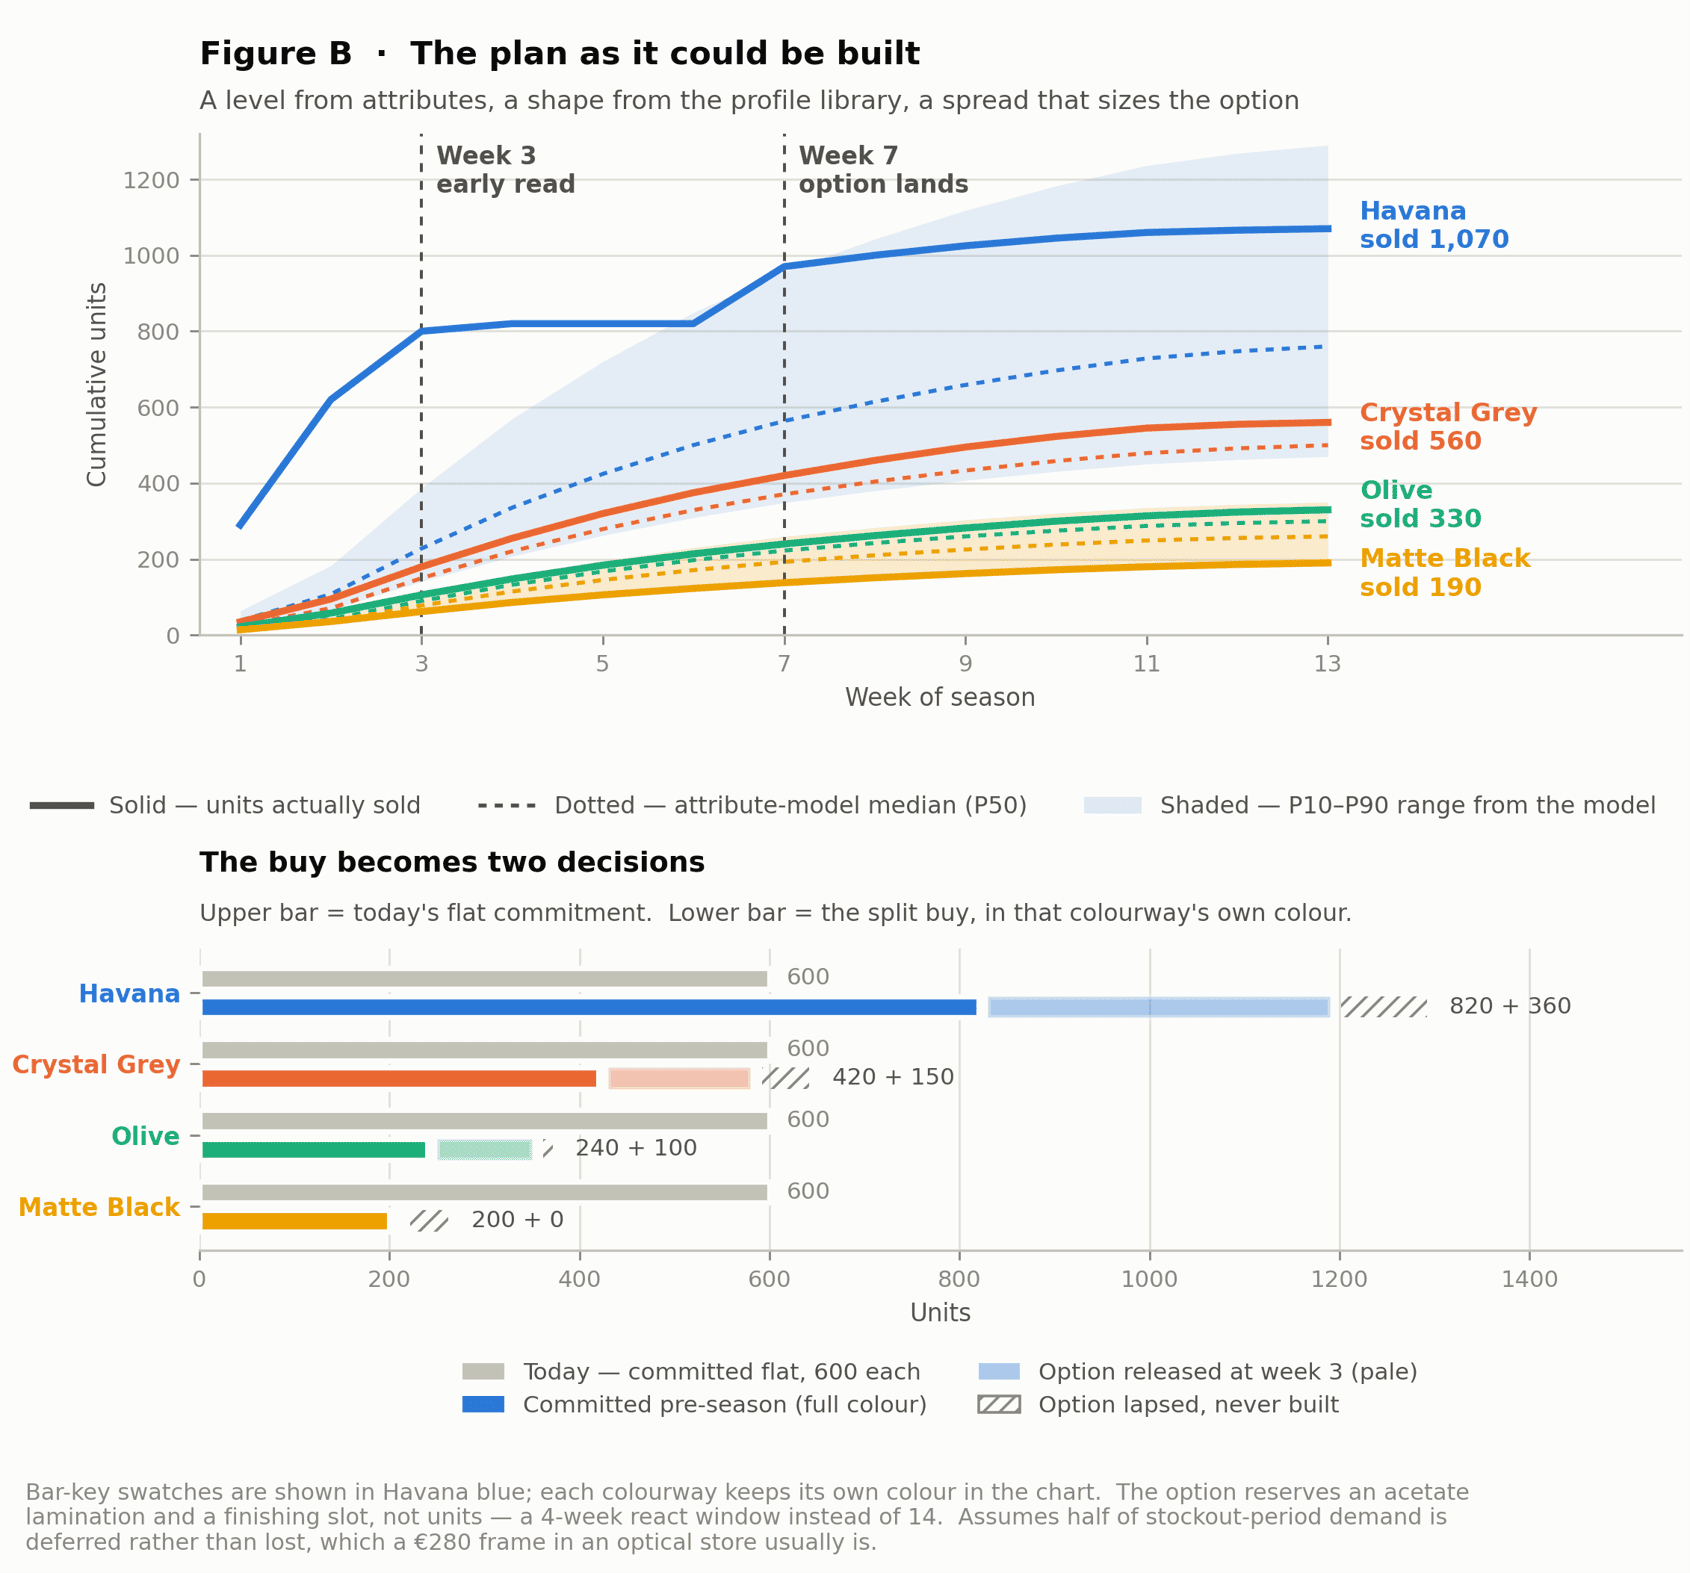
Put the two side by side and four things change.

  1. The weighted error at SKU level falls by more than half. That is the level at which money is committed, so that is the number that matters. The colourway that was going to sell gets a bigger opening commitment; the one that was not gets a smaller one. Nothing clever has happened. The model has simply stopped pretending that four different frames will sell the same quantity.
  2. Style-level error gets worse. This is the uncomfortable part, and it needs saying out loud. A model trained on incomplete history under-forecasts the winner, because the winner sold out and its recorded sales understate what it would have done. So the total for the style comes out lower than reality. If your forecast KPI is style-level accuracy, this will look like a failure in its first season. Change the KPI before you start, or do not start.
  3. Stock left over at season end drops, and so does unserved demand. Both at once, which is the whole point. Under the old plan you were wrong in both directions at the same time, short on one colour, long on three. Splitting the commitment lets you be less wrong on both.
  4. Cash committed at the tooling freeze falls. Part of the buy is now an option rather than an order. That is the real financial change: less money locked up before anyone has seen a customer.

Three cautions before anyone treats this as a proposal.

  1. A better forecast is still a bad forecast. The error does not disappear. It comes down far enough that an option sized from the spread can absorb what is left. The improvement is in how the buy is structured, not in the accuracy of the prediction and that is a more durable place for it to sit.
  2. The option is not free. Reserving material and a slot at the plant costs something, and some optioned units are never built at all. There is a price above which the trade stops paying, and that price comes out of a supplier negotiation rather than a model. Work it out before you promise anyone a saving.
  3. Not every style deserves an option. Most styles are not the one that sells out. The value of the spread is precisely that it tells you which ones are worth spending the option budget on and, just as usefully, which ones to leave alone.
 

At Smartlinks, This is The Kind of Problem We Take On

Every one of the three things above already exists as a feature somewhere in the market. Attribute-based forecasting ships in the major planning platforms. Launch profiles are standard. Nothing here needs inventing.

And yet almost nobody in this category plans this way, because the work is not in the feature. It is in the attribute definitions that have to be maintained season after season by people who would rather be doing something else. It is in scoring marketing's curve judgement so that it improves instead of drifting. It is in persuading a plant to sell a reserved slot instead of a confirmed order. It is in changing the forecast KPI before the new method makes the old one look bad.

That gap between a capability that exists and a decision that gets made is the work. The data exists. The constraint is understood. The planner already knows roughly what the right answer is. And no system in the landscape will let her act on it inside the time she has.

Ananya's tooling slot closes on Friday either way. The only question is whether the number she signs is one she can defend and whether the part she genuinely cannot know is something she has bought her way out of, or something she has simply hoped about.


SHYAM KUMAR N S SUPPLY CHAIN CONSULTANT

Author

We work faster than
you can even imagine


WhatsApp