Figure 3: Anatomy of a knowledge graph. The ontology defines what can exist; instance data records what does, with time, provenance and confidence on every relationship.
There are two broad families of graph technology. The choice matters less than vendors tend to suggest, but it helps to know the trade-offs.
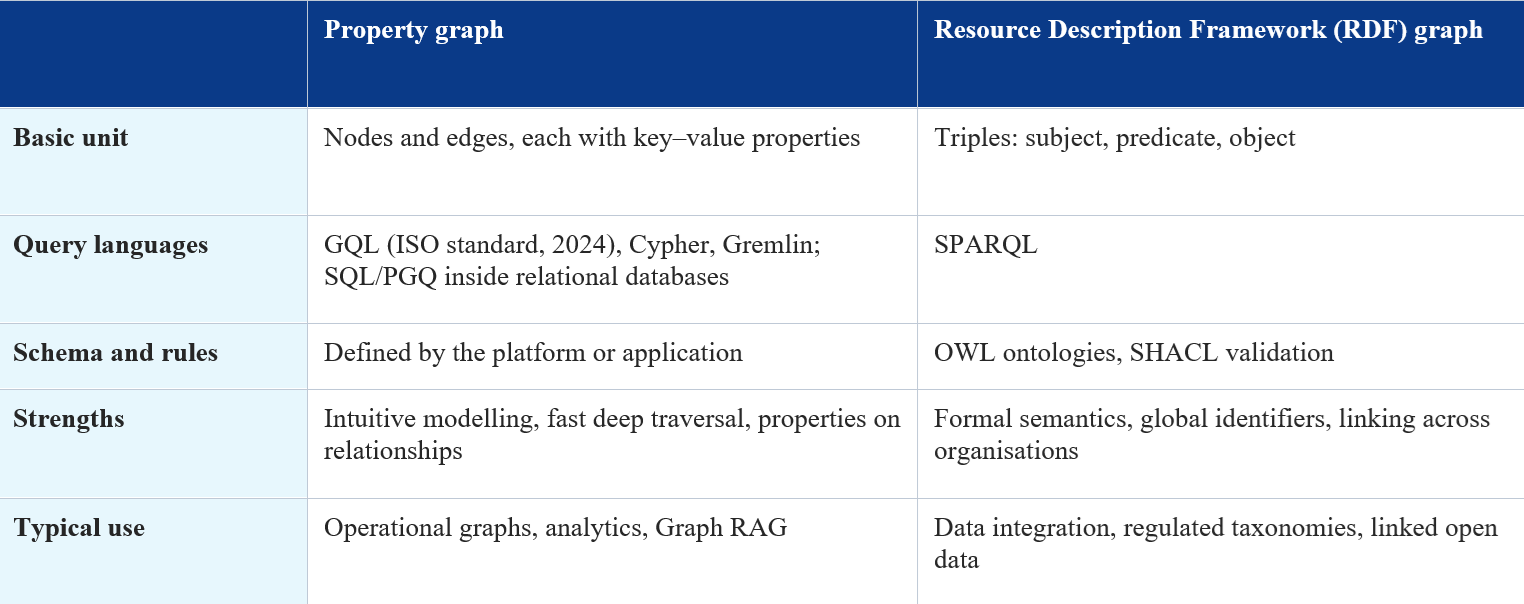
Table 1: Two families of graph technology.
Most operational supply chain graphs are property graphs, because properties on relationships (share of supply, lead time, confidence, validity dates) are exactly what supply chain questions need. Industrial platforms add a layer above the storage engine that matters more than the engine itself: connectors for information technology (IT), operational technology (OT) and engineering technology (ET) sources, contextualisation services that match tags, assets and documents, and a governed data model that applications and AI agents share.
WHY NOT JUST USE THE DATABASE WE ALREADY HAVE?
It is the right question to ask, and it has a precise answer. Here is Vikram’s question written as a graph query in Cypher, one of the most widely used graph query languages. GQL, the ISO standard, uses a very similar pattern syntax.

It reads almost like the sentence it answers. The *1..5 means “follow the component relationship through up to five levels of the bill of materials,” however deep the part sits. The relational version needs a recursive query to explode the bill of materials, joined across supplier, site, routing, order and customer tables:
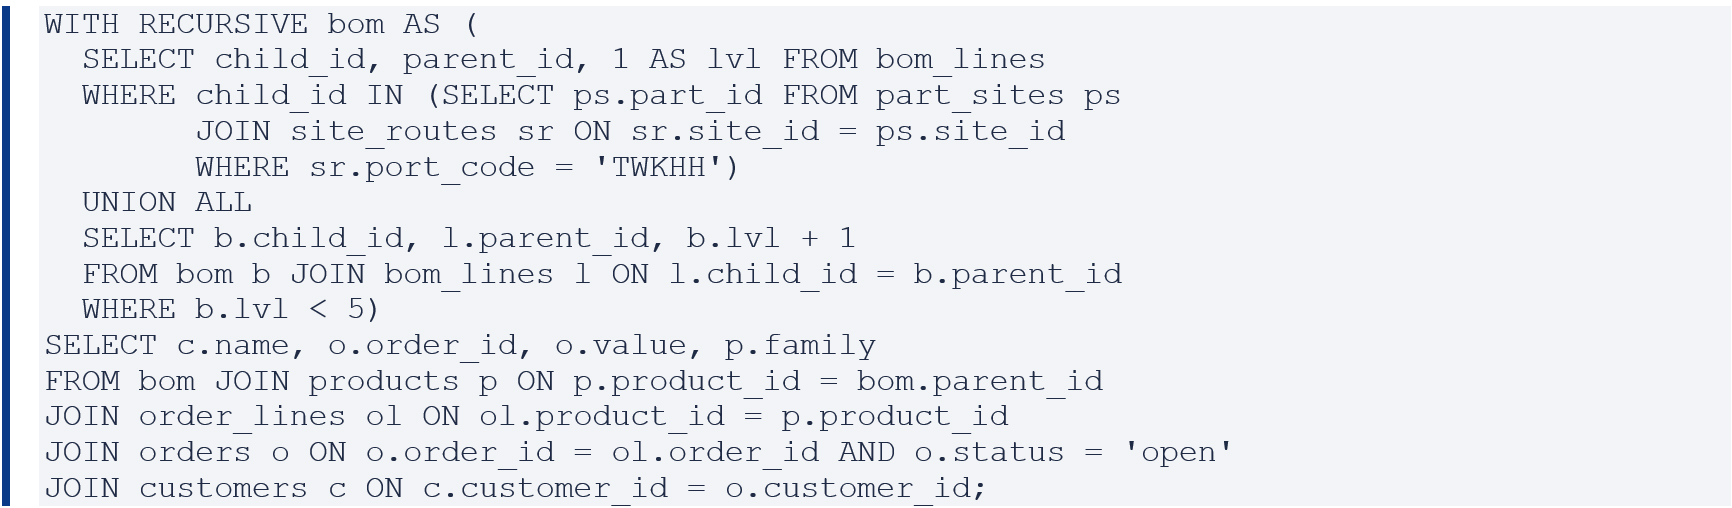
Three problems follow, and only the first is about performance.
Cost grows with depth. Each hop is another join, and recursive joins over large tables become expensive quickly. Native graph stores keep each node’s relationships alongside it, so following an edge is a direct step rather than an index lookup, and query cost depends on how much of the graph is touched rather than on how large the tables are.
The query is brittle. Add a new kind of relationship, such as a sub-tier site discovered in a document, and the SQL must be rewritten. In a graph, the new edge simply becomes part of the paths the same query can walk.
Most importantly, the tables do not exist. Look again at part_sites and site_routes. In Vikram’s company, as in most, no table records which plant makes a tier-2 part or which port that plant ships through. Those facts were in a PDF. A knowledge graph is not only a faster way to query relationships you already have; it is a place to put relationships you never had anywhere to store.
Two clarifications are worth making for anyone evaluating this. A knowledge graph does not replace ERP, TMS, WMS or PLM; they remain systems of record, and the graph becomes a system of context above them. Nor is it a data lake. A lake puts data side by side, but co-location is not connection.
WHY THE BUSINESS NEEDS IT
Strip away the technology and four business reasons remain. They compound.
The questions that matter are multi-hop. Which orders are at risk if a supplier is two weeks late? Which tier-3 sites sit behind our top ten products? If this port closes, what is our revenue exposure next quarter? Every one of these crosses three or more systems.
Exposure hides below tier one. Most enterprises know their direct suppliers well and their suppliers’ suppliers poorly. Vikram’s company had 1,140 suppliers in its master data and no visibility into the one plant that mattered.
Decisions have a shelf life. A buffer order placed on Monday morning secures supply at list price. The same order on day nineteen competes with every other buyer in the market. The value of an insight decays with every email it takes to assemble.
Institutional knowledge should not depend on who replies. Once a sub-tier link is in the graph, every planner, every category manager and every system can use it, on every shift, for every future event.
HOW A KNOWLEDGE GRAPH IS BUILT
Building a graph is less about choosing a database than about running a disciplined pipeline. There are six steps.
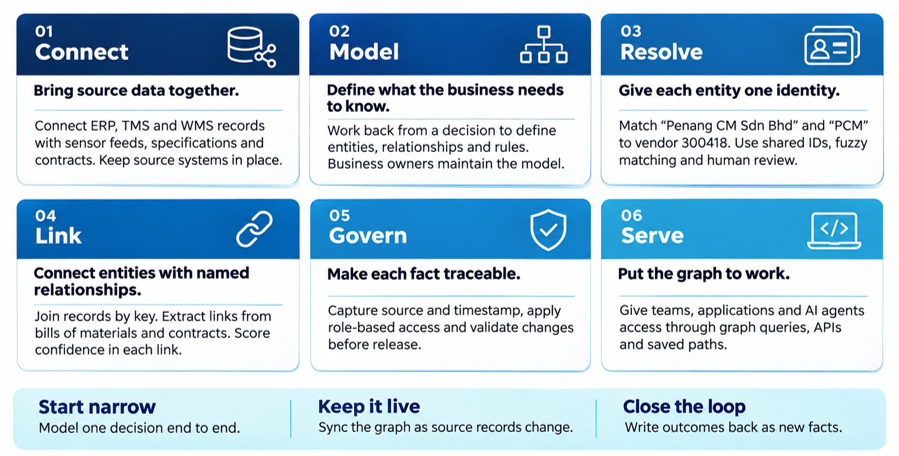
Figure 4: How a knowledge graph is built.
Connect. Sources come in through connectors and stay where they are. The graph needs orders, product structures, contracts and supplier records from the IT world; sensor, GPS and historian streams from operational technology; and specifications, drawings and site layouts from engineering. The aim is live synchronisation, not a quarterly export.
Model. Define the ontology, starting from the decisions it must support rather than from source schemas. For supply risk, that means suppliers, sites, parts, routes, products, orders and the relationships between them, with the properties those decisions need.
Resolve. Make every real-world thing one node. “Penang CM Sdn Bhd” in the ERP, “PCM” in a contract and vendor 300418 in a quality report are the same supplier. Entity resolution combines exact keys, fuzzy matching and human review. It is unglamorous work, and it decides whether every later answer is right.
Link. Create the relationships. Many come straight from keys in source systems. The rest, often the most valuable, must be extracted. This is where large language models have changed the economics. They can read a supplier’s bill of materials, a certificate of origin or a contract, propose structured relationships (this part, made at this site, shipped through this port), and attach a confidence score. Low-confidence extractions go to a person before they are trusted.
Govern. Every fact carries its provenance, timestamp and confidence; access is controlled by role; candidate facts are validated before promotion. Governance is what makes a graph safe enough for AI to act on.
Serve. Expose the graph to people and machines through graph queries, APIs, saved traversals for common questions and, increasingly, tools that AI agents can call.
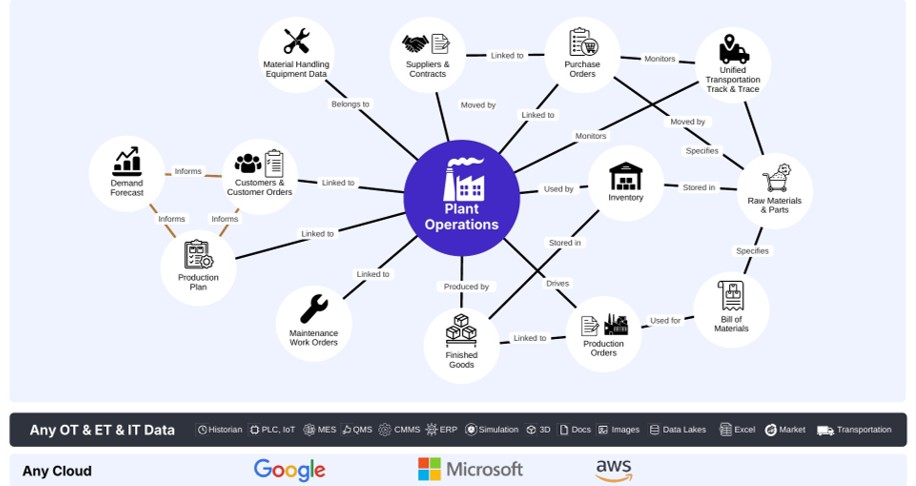
Figure 5: The extended knowledge graph for the supply chain. One model across suppliers, inventory, production, maintenance, customers and transport, fed by any IT, OT or ET source.
WHY NOW
Knowledge graphs are not new. Google launched its Knowledge Graph in 2012, and large banks and pharmaceutical companies have used graphs for years. What has changed is that four forces have arrived together: AI agents that act, persistent disruption, continuous operational data and cheaper tooling. Together, they move the knowledge graph from an interesting architecture to an operational necessity.
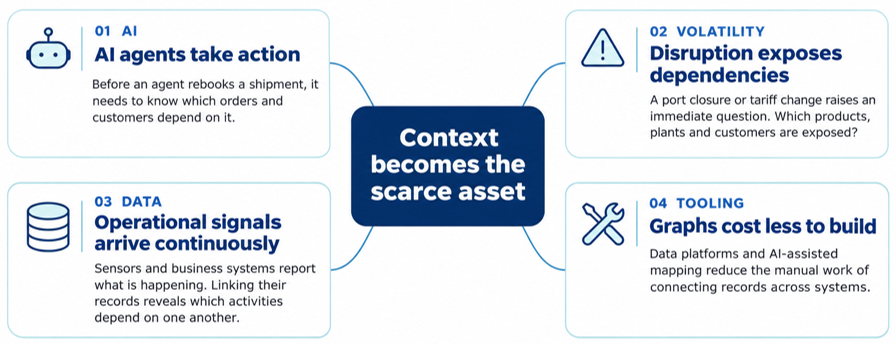
Figure 6: Four forces converge, and the scarce asset becomes context.
The first force, AI that acts, matters most. Until recently, AI in the supply chain mostly answered questions. It is now being asked to act: to place a buffer order, rebook a lane, reallocate stock. An AI that answers wrongly wastes a minute. An AI that acts wrongly costs money. Acting safely requires knowing what an action will touch, and that is exactly what a graph encodes.
The fourth force, cheaper tooling, deserves a note for technology leaders, because it removes the oldest objection. The most expensive part of a knowledge graph has always been the linking: reading documents and turning them into relationships by hand. LLM-assisted extraction now does the first pass of that work, with people reviewing the uncertain cases. Standards have matured too. GQL became an ISO standard in 2024, and the SQL standard now includes property graph queries. Graph projects that once took eighteen months to show value can now show it on a single use case in weeks.
WHY AI NEEDS A GRAPH
Large language models are remarkable reasoners, but they reason over whatever context they are given. Ask a general-purpose model whether Vikram’s company is exposed to Kaohsiung and it can only guess. It has never seen his bill of materials.
The common remedy is retrieval-augmented generation, or RAG. Documents are split into chunks and converted into vectors, numerical representations of meaning. When a question arrives, the chunks most similar to it are retrieved and placed in the prompt. This works well for “what does our contract say about force majeure?” It works poorly for Vikram’s question, for a structural reason: similarity is not connection. No chunk of text says that a Taiwanese plant sits behind a Malaysian supplier behind a motor drive behind a customer order. That fact exists only as a path. So vector search retrieves more and more loosely related text, the prompt swells, cost rises, and the answer remains hard to verify.
GraphRAG, an approach popularised by Microsoft Research in 2024 and since widely adopted, puts the graph into the retrieval step. In practice it runs in five stages: link the entities in the question to nodes; retrieve a bounded subgraph around them, filtered by time, status and access rights; serialise only the relevant paths into the prompt, each fact tagged with its source; let the model reason over those facts alone; and return an answer whose every line points back to a record.
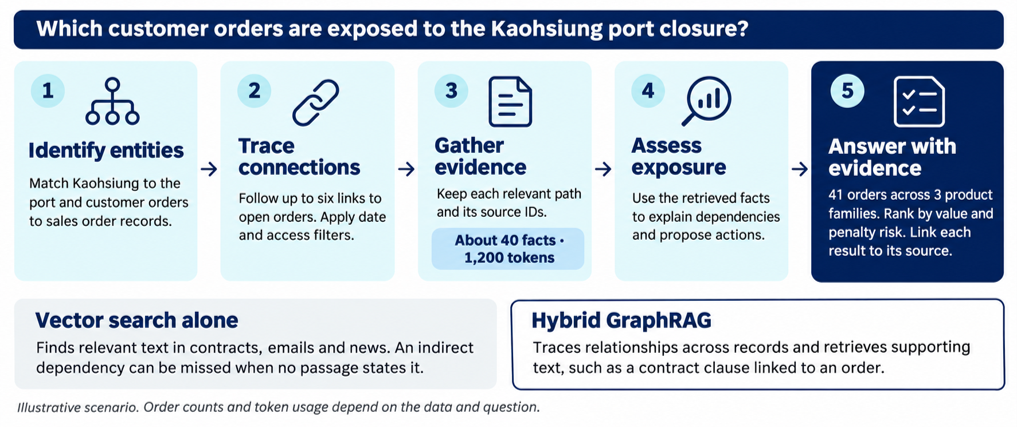
Figure 7: The graph supplies structure and paths; the language model supplies reasoning and language; every claim stays traceable.
The model now sees a small set of connected, verified facts instead of a pile of similar documents. In an illustrative example, a supplier-delay question costs around 30,000 tokens through document search and around 1,200 through the graph, roughly twenty-five times fewer, and the graph’s answer can cite every step.
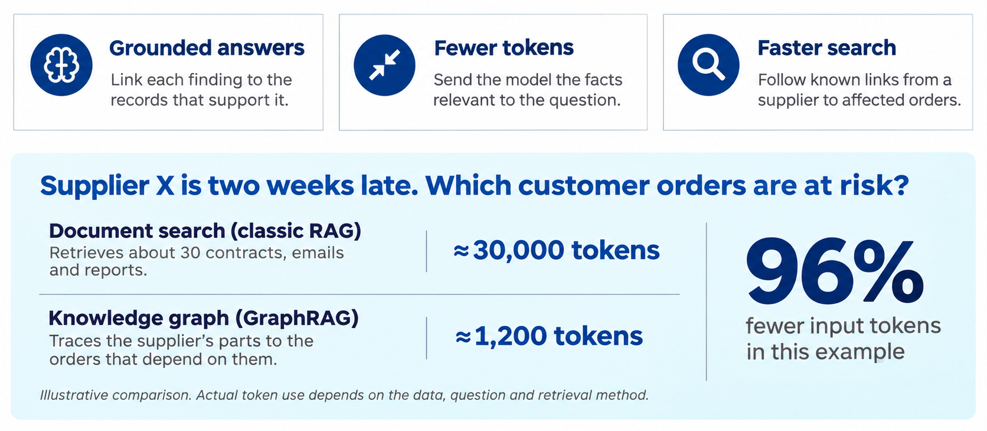
Figure 8: Why AI runs better on a graph. Grounded, cheaper and faster, with multi-hop reasoning in a single pass. Figures are illustrative; actual savings depend on data volume and question complexity.
The most effective systems are hybrid. The graph carries structure and relationships, while vector search works inside nodes for unstructured detail, such as finding the penalty clause in the contract linked to a particular order.
A further benefit appears once you move from one assistant to several agents. Specialised agents for disruption, resilience, ETA, docks, cold chain, claims and customer communication never message one another directly. They read from and write to the graph. When one agent changes the truth, every other agent sees it, and integration stops being a web of point-to-point connections. Because the graph sits underneath, governance sits there too. Below 80% confidence, an agent proposes and never acts. Decisions above a value ceiling go to a person. Supplier swaps and cross-border moves always involve a human. Every decision is signed and retained.
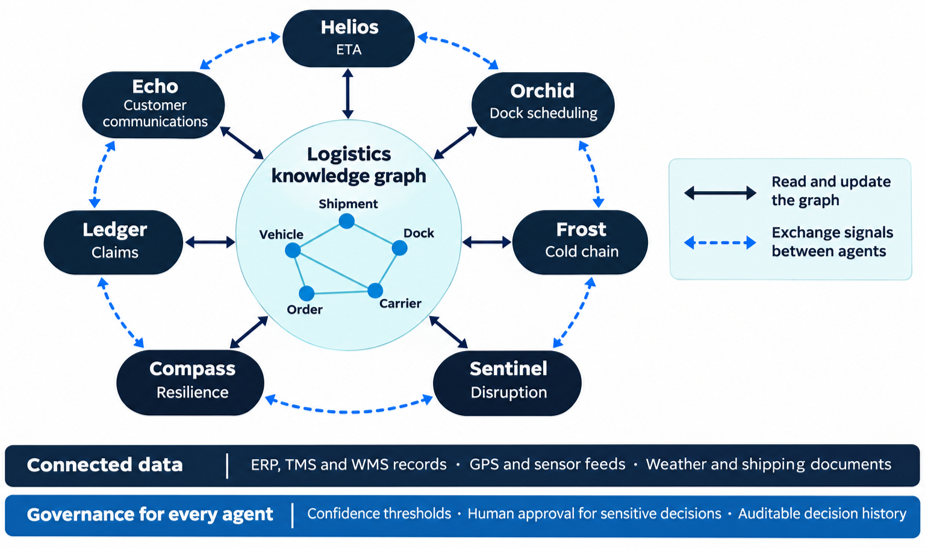
Figure 9: Agents collaborate through the graph, not with each other. Cognite Data Fusion holds the knowledge graph; each Atlas AI agent reads and writes within explicit guardrails.
MONDAY AGAIN
Now replay Vikram’s week with a knowledge graph in place.
At 22:10 on Saturday, a port-status feed reports Kaohsiung closed. The event is written to the graph and linked to the port node. Within a minute, a disruption agent runs the exposure traversal. It walks six hops: port to the IGBT plant, plant to the Penang manufacturer, manufacturer to the drive board, board to the motor drive, drive to three compressor families, families to forty-one open orders. The tier-2 link is there because the Penang manufacturer’s BOM was parsed during onboarding, and a quality engineer validated the extraction.
When the CEO’s message arrives at 07:40 on Monday, the answer is already waiting, ranked by value and penalty exposure. Inventory on hand and in transit covers twenty-three days. One of the three families can use an alternative drive that is already qualified. The data-centre order is the one that matters.
At 08:30 the agent proposes two actions: a buffer order against the Penang manufacturer’s existing board stock, and a formal allocation request. Both exceed the agent’s value ceiling, so both go to Vikram with the evidence attached. He approves at 10:15. The orders are placed days before the rest of the market understands what has happened.
On Thursday the board hears something different: exposed, quantified, mitigated.
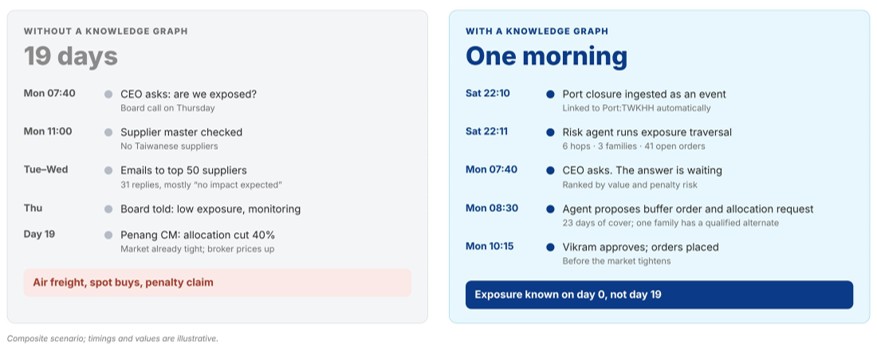
Figure 10: One typhoon, two Mondays. Same event, same data. The difference is whether the data is connected. Composite scenario; timings illustrative.
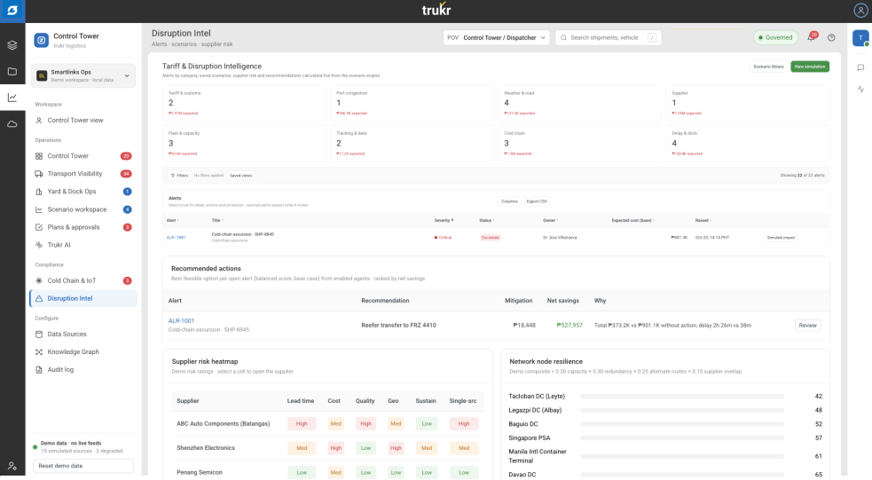
Figure 11: Disruption intelligence on a live graph. Scenario simulations, a supplier risk heatmap across six risk dimensions and network resilience scores, all computed against the same knowledge graph.
The AI does not decide for Vikram. It does the hundred small things (finding the path, quantifying exposure, drafting options) so that he can make the one big call, early.
THE FEEDBACK LOOP
Answering one question quickly is valuable. What makes a knowledge graph strategic is what happens after the question has been answered.
Every decision has an outcome. The buffer order arrived on time, or it did not. The Penang manufacturer honoured its allocation or cut it again. The alternative drive passed first-article inspection or failed. In most organisations, outcomes like these disappear into email and memory. In a graph-based system they are written back.
The loop has five steps.
- Connect: ERP, WMS, TMS, supplier and IoT data are linked into one graph.
- Ask: a planner or an agent poses a question, such as which orders are at risk this week.
- Reason: graph traversal and a language model find the exact impact path.
- Act: the chosen response is carried out, such as expediting, rerouting, switching supplier or rebalancing stock.
- Learn: the outcome is written back as new facts, such as actual lead times, supplier scores and new risk links.
Technically, write-back means three things. Decisions are stored as nodes, linked to the evidence they used and the actions they triggered. Outcomes are stored as events, linked to the decisions that caused them. And properties that summarise behaviour, such as lead-time distributions, on-time rates and allocation reliability, are recomputed as new events arrive. Nothing is overwritten. History is kept, so the graph can always explain how it came to believe what it believes.
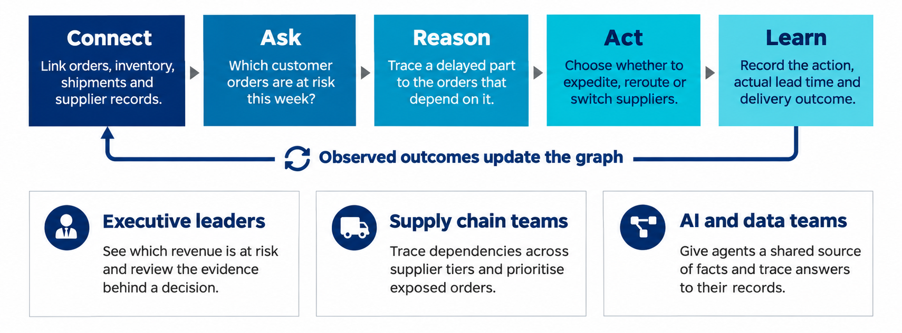
Figure 12: A supply chain brain that learns. Every outcome becomes new knowledge, and each group of leaders gets something different from it.
SELF-LEARNING, WITHOUT RETRAINING A MODEL
“Self-learning AI” usually suggests an expensive picture: data science teams, training runs, model versions, drift monitoring. The knowledge graph approach is different. The language model does not change; the knowledge it reasons over does. For most operational leaders that is the more useful kind of learning, because it is faster, cheaper and auditable.
The graph learns in four distinct ways. They are worth naming, because each deserves a different level of trust.
Observed learning. Properties are updated from transactions. Every goods receipt refines a supplier’s lead-time distribution, so after sixty-four receipts the graph no longer believes the quoted ten weeks; it knows the median is eleven and the ninetieth percentile is fifteen. This is measurement, and it can be trusted immediately.
Extracted learning. New relationships are read from documents as they arrive: a revised BOM, a supplier declaration, an engineering change notice. Each extraction carries a confidence score and its source. High-confidence facts are promoted; uncertain ones wait for review.
Inferred learning. Graph algorithms and machine learning propose relationships that nobody has stated. Link prediction might suggest that two suppliers share a sub-tier source because their disruptions keep coinciding, or that a candidate manufacturer fits a board family. Inferred facts are always held as pending until a person validates them.
Computed learning. Risk propagates along edges. When a tier-2 site is flagged, the exposure flows to every supplier, part, product and order that depends on it, using path-based and centrality scoring. A supplier that looked low-risk in a tier-1 view becomes high-risk the moment its dependency is known.
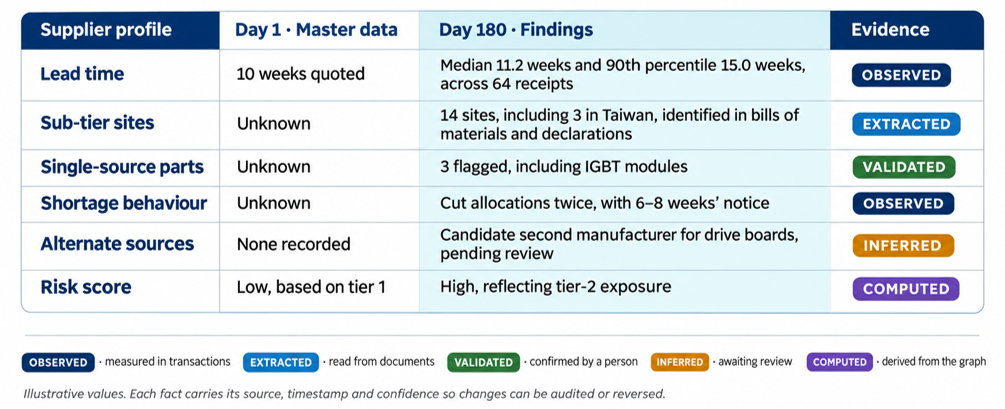
Figure 13: The graph learns; the model doesn’t have to. One supplier, before and after six months of written-back outcomes. Values are illustrative.
Beyond these four, there is a quieter form of learning: decision memory. Because past decisions and their outcomes are stored as connected nodes, an agent facing a new disruption can retrieve precedents, such as what happened the last time this supplier cut allocation and which response worked, and reason from them. That is institutional experience, made queryable.
Two cautions, because a learning system deserves scepticism. First, learning is only as good as what is written back; if outcomes are not captured, nothing compounds. Second, every learned fact must carry its source, timestamp, method and confidence, so that a bad inference can be traced and rolled back. A graph that learns without provenance is just a faster way to spread a mistake.
Done properly, the result is a compounding asset. Competitors can buy the same software and the same language models. They cannot buy two years of your validated sub-tier links and written-back outcomes.
THE KNOWLEDGE GRAPH ACROSS THE SUPPLY CHAIN
Vikram’s typhoon is one thread. The same graph, extended across the operation, answers questions that today belong to different teams using different tools.
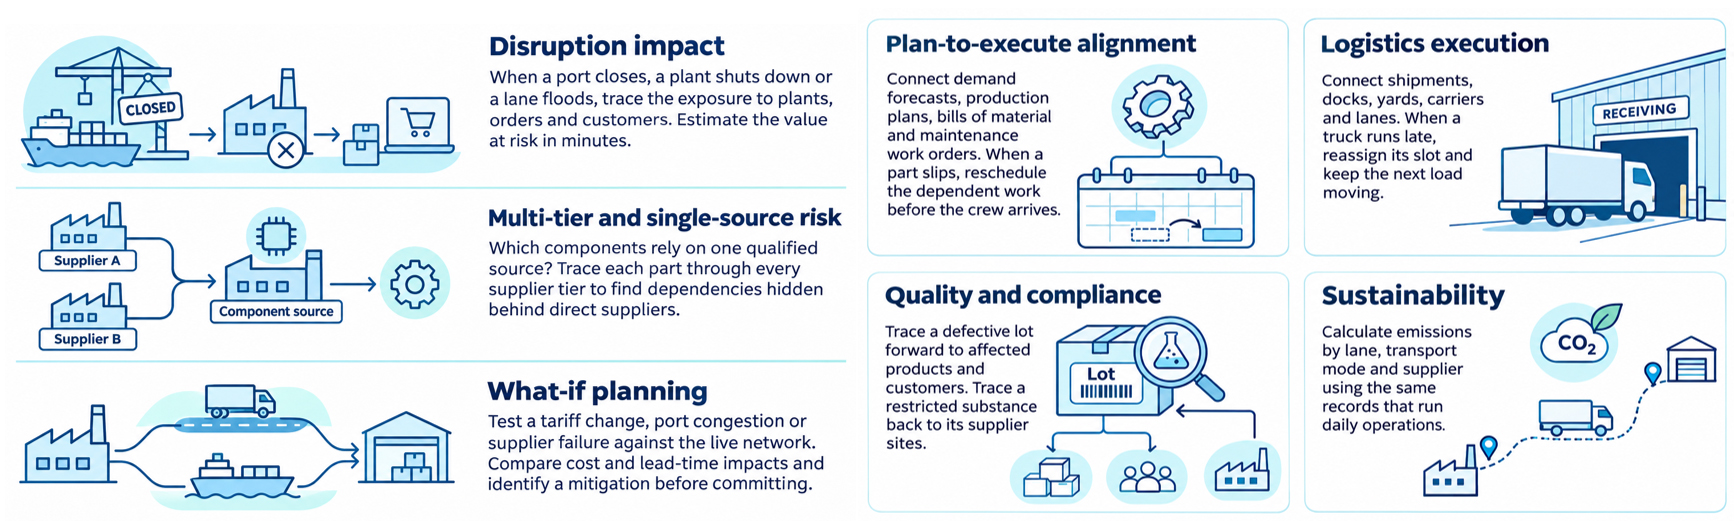
Figure 14: One graph, many questions: from disruption impact and multi-tier risk to quality, logistics and sustainability.
Each group of leaders takes something different from the same layer. For the C-suite: faster, more defensible decisions, risk visible before it reaches revenue, and lower AI running cost at scale. For supply chain teams: disruption impact in minutes, visibility beyond tier one, and less firefighting. For AI and data teams: agents grounded in facts, outputs that can be explained and audited, and one reusable knowledge layer instead of a new pipeline for every use case.
WHAT HAS TO BE TRUE
Knowledge graph programmes fail in predictable ways, and the technology is rarely the reason. Three things must be true.
Start from decisions, not data. The instinct is to model the whole enterprise first. That is how graph projects become eighteen-month modelling exercises that never reach an operator. Start from one decision that hurt, such as Vikram’s Thursday board call, and model exactly the entities and relationships that decision needs. Extend from there.
The ontology belongs to the business. What counts as a critical part, which supplier is a qualified alternate, how far down the tiers you need to see: these are supply chain judgements, not schema choices. If supply chain leaders do not own the model, the graph will be technically correct and operationally useless.
Governance comes before autonomy. Provenance on every fact, validation before promotion, confidence floors, value ceilings, human approval for sensitive actions, an immutable audit trail and a kill switch. These are not features to add later. They are what lets a chief supply chain officer trust an agent to act on a Saturday night.
Get those three right and the graph stops being an IT project and becomes an operating asset.
AT SMARTLINKS, THIS IS THE WORK WE DO
A knowledge graph is not a product you install. It is a model of how your business actually works, built around the decisions that matter to you and connected to the systems you already run. Doing it well takes two things that rarely live in the same team: deep supply chain judgement and production-grade AI engineering. That combination is where Smartlinks sits.
We bring decades of planning depth across demand, supply, inventory and logistics: the knowledge of which relationships matter, and why. We build on an industrial knowledge graph platform, with AI agents, that provides one governed semantic layer across IT, OT and ET. And our AI-native delivery team builds and ships production-grade agents in weeks, rather than in pilots that quietly fade away.
We usually start with one question. Bring us the disruption that hurt you most last year. We will trace it through your systems with you: where each fact lived, which relationships were missing, what a knowledge graph would have known and when, and what the first working slice of your graph would look like. If the answer is that a graph is not your bottleneck, we will tell you that too.
Vikram’s typhoon still came. The port still closed. The only question was how long it took his company to understand what that port was connected to.
How long would it take in yours?
